Table of Contents

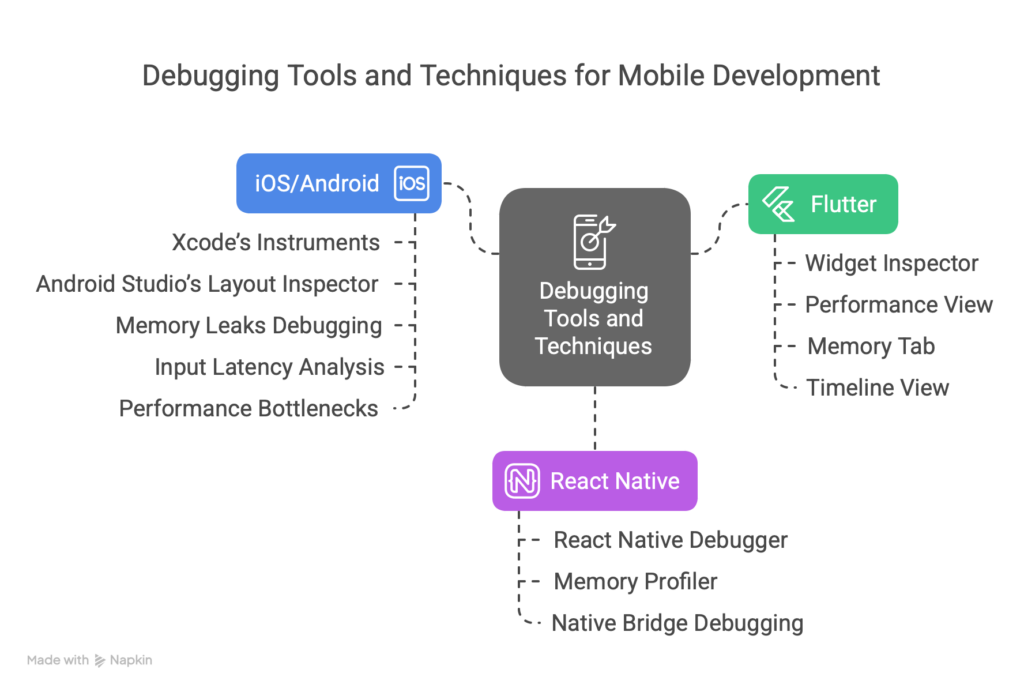
Debugging virtual keyboards can be tricky because each framework – Flutter, React Native, and native iOS/Android – handles input, rendering, and events differently. Here’s how you can tackle common challenges:
- Flutter: Use tools like the Widget Inspector for layout issues and the Performance View to monitor response times. Diagnose memory leaks with the Memory tab and track event handling with the Timeline View.
- React Native: Leverage the React Native Debugger to inspect components and monitor performance. Debug the native bridge for communication issues and use tools like the Memory Profiler for memory management.
- iOS/Android: Use Xcode’s Instruments and Android Studio’s Layout Inspector for deep system-level analysis. Debug memory leaks, input latency, and performance bottlenecks with their respective profiling tools.
Quick Comparison
| Feature | Flutter | React Native | Native (iOS/Android) |
|---|---|---|---|
| Hot Reload | Yes (real-time updates) | Yes (2–3s reload) | No (requires full build) |
| Performance Tools | DevTools CPU Profiler | Metro, Hermes Engine | Xcode/Android Profilers |
| Memory Analysis | Built-in Memory tab | Chrome DevTools | Instruments/Memory Profiler |
| Layout Debugging | Widget Inspector | React DevTools | Layout Inspector |
Focus on framework-specific tools to debug efficiently. Whether it’s optimizing multilingual keyboards, fixing input lag, or ensuring smooth integration, these tools can help you deliver a seamless experience across platforms.
1. Flutter Debugging Methods

Flutter’s DevTools provide several tools to debug virtual keyboard implementations effectively. Tools like the Widget Inspector and Performance View are particularly helpful for identifying and resolving keyboard-related problems. Here’s how they can assist with debugging.
Widget Inspector for Keyboard Debugging
The Widget Inspector allows developers to visualize the hierarchy of keyboard layouts and pinpoint rendering problems. Some of its key features include:
- Layout Explorer: Analyze how keyboard components are positioned and spaced.
- Properties Explorer: Observe state changes during keyboard interactions.
- Selection Mode: Inspect specific keyboard elements dynamically while the app is running.
Performance Profiling
The Performance View is useful for monitoring how the keyboard performs under various conditions. It enables developers to:
- Measure keyboard response times in milliseconds.
- Detect frame rendering issues and identify any lag during fast typing.
Debugging Common Issues
Here’s a quick guide to diagnosing and fixing frequent keyboard-related issues:
| Issue Type | Debugging Approach | Common Solution |
|---|---|---|
| Overflow Errors | Enable Debug Paint | Use resizeToAvoidBottomInset. |
| Input Lag | Use the CPU Profiler | Optimize gesture handlers. |
| Missing Keys | Inspect the Render Tree | Check widget build methods. |
Memory Leaks: Use the Memory tab to monitor the lifecycle of keyboard instances. Always dispose of keyboard controllers properly when transitioning between screens or app states.
Event Handling: The Timeline View tracks events from the initial touch input through the widget tree to final rendering. This tool provides insights into how to optimize keyboard performance.
Best Practices
To streamline your debugging process, consider applying these practices:
- Enable
debugPrintBeginFrameBannerto monitor frame rendering. - Use
debugDumpRenderTree()for a detailed analysis of the layout structure. - Add
debugPrint()statements thoughtfully within keyboard event handlers.
The CPU Profiler is particularly useful for spotting performance bottlenecks in animations and text processing. Focus on methods that take more than 16ms to ensure your app maintains a smooth 60fps frame rate.
For multilingual keyboards, the Widget Inspector can verify character rendering and layout adjustments for different locales. Pay attention to the rebuild cascade when switching between languages to ensure efficient state management.
2. React Native Debug Tools

React Native provides a variety of tools to debug virtual keyboard development effectively. The React Native Debugger, which merges React DevTools with Chrome DevTools, gives detailed insights into how keyboards behave.
Core Debugging Features
The React Native Inspector allows you to dive deep into keyboard components. With it, you can:
- Visualize the component hierarchy
- Monitor props and state changes
- Track touch events
- Measure layouts in device-independent pixels (dp)
These tools work alongside other React Native debugging features, helping improve virtual keyboard performance.
Performance Monitoring Tools
React Native includes performance tools to pinpoint and fix keyboard-related issues. Here’s a quick overview:
| Tool | Purpose | Key Metrics |
|---|---|---|
| Metro Bundler | Tracks hot reload times | Refresh time (ms) |
| Hermes Engine | Analyzes JavaScript execution | Memory usage, CPU load |
| Performance Monitor | Monitors typing performance | Frames per second (FPS) |
Native Bridge Debugging
Debugging communication between JavaScript and native modules is essential for solving keyboard issues. Developers can:
- Inspect the message queue
- Analyze traffic between JavaScript and native code
- Measure the timing of native method calls
- Monitor event dispatch patterns
Development Environment Setup
To set up your environment for debugging keyboards, use the following configuration:
global.XMLHttpRequest = global.originalXMLHttpRequest || global.XMLHttpRequest;
global.FormData = global.originalFormData || global.FormData;
Memory Management
The Memory Profiler is useful for identifying memory leaks in your keyboard implementation. It helps you:
- Monitor component lifecycles
- Track memory allocation trends
- Identify retained objects
- Analyze garbage collection activity
Remote Debugging
You can enable remote debugging with Chrome DevTools by following these steps:
- Connect to the development server.
- Open the in-app developer menu and select “Debug JS Remotely.”
- Access the Chrome DevTools console to view network requests, console logs, and JavaScript execution details.
Error Boundary Implementation
To handle rendering errors in your keyboard, use an error boundary. Here’s an example:
class KeyboardErrorBoundary extends React.Component {
  componentDidCatch(error, errorInfo) {
    console.error('Keyboard Error:', error);
  }
  render() {
    return this.props.children;
  }
}
Network Monitoring
The Network Inspector is helpful for debugging network-related keyboard operations. It can track:
- API calls for language models
- Dictionary updates
- Configuration synchronization
- Resource loading times
Optimizing these network interactions ensures your keyboard remains responsive and manages data efficiently. This approach supports a well-rounded debugging strategy tailored for virtual keyboards.
3. iOS and Android Debug Tools
Native debugging tools play a crucial role in streamlining keyboard development for iOS and Android. Here’s a breakdown of their key features and how they enhance the debugging process.
iOS Debugging with Xcode

Xcode’s Instruments suite offers a range of tools tailored for iOS keyboard development:
| Tool | Purpose | Key Metrics |
|---|---|---|
| Time Profiler | Analyzes CPU usage | Processing time (ms) |
| Allocations | Tracks memory usage | Memory footprint (MB) |
| Network | Monitors API calls | Response time (ms) |
| Energy Log | Evaluates battery usage | Power consumption (mW) |
iOS Debug Console
The Xcode Console is invaluable for observing keyboard behavior in real time. It allows developers to:
- Log keyboard events as they happen
- Catch memory warnings
- Debug layout constraints
- Monitor input method switching
Android Studio Debugging

Android Studio provides powerful debugging tools for Android keyboard development. Here’s a quick example of how to log keyboard events:
// Adding debug logs for keyboard events
override fun onKey(primaryCode: Int, keyCodes: IntArray?) {
    Log.d("KeyboardDebug", "Key pressed: $primaryCode")
    performKeyOperation(primaryCode)
}
Layout Inspector
The Layout Inspector in Android Studio is a handy tool for visualizing keyboard view hierarchies. It helps developers:
- Examine view properties
- Analyze rendering performance
- Debug layout issues effectively
Memory Profiling
Memory profiling tools on both platforms are essential for ensuring efficient resource use. They help identify:
- Memory leaks in keyboard components
- Heap allocations during text input
- Object retention issues
- Inefficient resource cleanup
Performance Monitoring
Performance tools on iOS and Android track critical metrics for keyboard optimization, such as:
- Input latency: Measures the delay between a keypress and its display
- Rendering speed: Tracks frame rates during typing
- Resource usage: Monitors CPU and memory consumption
- Battery impact: Evaluates power usage patterns
Native Crash Analytics
Crash analytics tools provide insights into app stability. They help developers:
- Detect and analyze keyboard crash patterns
- Generate detailed stack traces for debugging
- Monitor ANR (Application Not Responding) events
- Track overall stability metrics
System Integration Monitoring
Debug tools also assist in monitoring how well the keyboard integrates with the system by tracking:
- Input method switching
- Language model loading
- Dictionary updates
- System resource allocation
Framework Comparison
Below is a breakdown of how each framework handles debugging tools and environments, focusing on their capabilities for virtual keyboards. This comparison highlights the tools available and their distinct features.
Core Debugging Features
| Feature | Flutter | React Native | Native (iOS/Android) |
|---|---|---|---|
| Hot Reload | Real-time updates (ms) | Live reload (2–3s) | Build required (15–30s) |
| Performance Profiling | DevTools CPU profiler | Metro bundler | Xcode/Android profilers |
| Memory Analysis | Memory tab | Chrome DevTools | Instruments/Android Studio |
| Network Monitoring | Network tab | Flipper | Charles/Wireshark |
| Layout Inspection | Widget Inspector | React DevTools | Layout Inspector |
The complexity of setting up the debugging environment also varies:
| Framework | Setup Time | Tools | Complexity |
|---|---|---|---|
| Flutter | 10–15 min | VS Code/Android Studio | Low |
| React Native | 20–30 min | Chrome DevTools/Flipper | Medium |
| Native | 5–10 min | Platform-specific IDEs | High |
Framework-Specific Advantages
Each framework brings its own strengths to the table when it comes to debugging:
Flutter:
- Visualizes layouts in detail with the Widget Inspector.
- Offers real-time performance overlays.
- Includes tools for detecting memory leaks.
React Native:
- Provides tools for inspecting the component hierarchy.
- Enables monitoring of network requests.
- Includes debugging tools for state management.
Native Platforms:
- Allows for diagnostics of system APIs at a deeper level.
- Delivers highly detailed performance insights.
- Supports native crash reporting for debugging.
Performance Monitoring Capabilities
Key performance metrics differ across frameworks:
| Metric | Flutter | React Native | Native |
|---|---|---|---|
| Input Latency | Built-in timeline | Manual tracking | Platform tools |
| Memory Usage | Heap view | Basic stats | Full analysis |
| CPU Usage | Timeline events | Metro metrics | System tracking |
| Frame Rate | Observatory | FPS monitor | Platform tools |
Debug Log Management
| Aspect | Flutter | React Native | Native |
|---|---|---|---|
| Log Levels | 5 levels | 4 levels | Platform-specific |
| Filtering | Built-in | Custom | Advanced |
| Export | JSON/txt | Console | Multiple formats |
Integration Testing Support
| Testing Type | Flutter | React Native | Native |
|---|---|---|---|
| Unit Tests | Built-in | Jest | XCTest/JUnit |
| Integration | integration_test | Detox | XCUITest/Espresso |
| Performance | DevTools | Custom metrics | Platform tools |
For developers working with the Fleksy Keyboard SDK on iOS and Android, these insights can help fine-tune performance and simplify debugging workflows.
Conclusion
Debugging approaches tailored to specific frameworks play a key role in virtual keyboard development. Tools vary across platforms: Flutter’s hot reload allows for quick testing, while native platforms provide deeper access to system-level insights.
These user experiences highlight key debugging strategies:
- Framework-Specific Tools: Use the debugging features integrated into each framework.
- Performance Monitoring: Take advantage of built-in profilers and overlays to track performance.
- Security Checks: Ensure secure text input with rigorous debugging protocols.
Creating a successful virtual keyboard depends on effectively using the debugging tools provided by each framework. Features like autocorrection and predictive text demand careful attention to detail, especially when supporting multiple languages.
As frameworks continue to improve, debugging methods will advance as well. Staying informed about the latest tools and practices is crucial for leveraging each platform’s strengths while delivering a smooth and reliable user experience.
